Online retail in the United States has increased by six percent between 2021 and 2022, with projections showing global e-commerce sales set to reach over $8 trillion by 2025. If these numbers catch your eye and you’re curious about how you can propel your business to these heights, you’ll want to tune your dial to the world of data.
The Data Difference
Analytics, reporting, and hard data help retail businesses of all sizes make smarter decisions about their overall strategies and everyday goals. Having clear and precise insights into how your business performs is beneficial not only to growing your revenue but to satisfying and building your customer base as well.
It’s important for today’s retail business owners to have data on hand so they can adjust as needed and focus their efforts on the areas that truly need it. Different reports give retailers glimpses into how their business is performing, but when viewed all together, they paint a bigger picture of the business as a whole. Once sellers have access to this information and learn how to use it, they can make the appropriate accommodations and their shoppers will benefit from a better experience.
Understanding CS Analytics
Retailers using the CommentSold platform have access to robust analytics that can help shape, define, and propel their businesses to the next level. CS Analytics allow sellers to do the following:
- Know their revenue by tracking key metrics, such as growth trends, by date, margins, and order value.
- Know their channels so they can see where they convert best to diversify and strengthen their selling avenues.
- Know their operations by understanding their fulfillment breakdown to maximize employee efficiency.
Maximizing Your Sales Channels with Analytics
Gaining insights into revenue by sales channels will help retailers maximize the channels that are performing well—and paying extra attention to the channels that aren’t. For example, your business might have a large Facebook following, so you may be inclined to focus a lot of your marketing or live selling efforts on that social platform. However, your analytics might show that more sales are actually being made on your mobile app.
With this new information, you can adjust your marketing and sales strategies to either encourage your large Facebook following to get your app for extra perks and incentives, thus driving downloads, or pull back a bit on your Facebook posts and look for new ways to deliver an unforgettable shopping experience on your app.
Maybe your analytics show that sales are up on Facebook but down on your webstore. This is a great opportunity to post on your Facebook Page and Group, reminding your shoppers to head to your website to see new products, tune in to live sales, register, and more.
Analyze & Strategize
Analyzing your past sales performance across channels will help you do the following:
- See what has gone well and where you are underperforming.
- Determine where you should focus your efforts moving forward.
- Spot trends and use those insights to plan ahead.
- Replicate what’s going well.
- Avoid what’s going wrong—or give some TLC to these areas to improve performance.
By viewing your reporting and using hard data to shift and evolve your business, you’ll be delivering an improved shopping experience to customers and moving your brand forward in new and exciting ways. Whether consciously or subconsciously, shoppers will notice the changes you make, positioning your brand as an active and exciting digital store. Perhaps you’re redesigning your website to be more user-friendly or creating more engaging content on Facebook. Having data on hand will help you and your team determine where you should be focusing your time and attention—and will help you deliver a better experience to shoppers overall.
Three Sets of Data to Shape Your Sales Strategy
If you’re digging into CS Analytics to review insights and data points on your overall performance, there are a few metrics tied to revenue that you’ll want to keep an eye on.
- Revenue by Date
You’ll first want to select a period of time depending on your retail sales goals and benchmarks. After choosing your start and end dates, you can gain an overview of how much money you made per day within that timeframe. You can view a graph to better visualize the peaks and valleys in your data, then dig in to view revenue on specific dates. If you see a large spike for one day, you may take a closer look and see that it fell on a holiday where you launched a big sale. Also, take a look at large dips to determine why sales fell on that particular day. - Revenue by Channel
This data will show you how much revenue comes in through each of your specific selling channels, such as your webstore, live replays, mobile app, and more. If you see a dip in revenue for one channel, you can use this information to take action. Encourage your shoppers to purchase in multiple ways—for example, if you see low live replay revenue numbers, during your next live sale, you can communicate on-camera that viewers can still shop after the live video has ended. This is a great opportunity for customer education, which can help boost your revenue numbers. - Revenue by Payment Method
You can see just how much money comes in through each of your payment gateways, including PayPal, Sezzle, and CS Payments. Offering your customers multiple payment methods adds convenience and strengthens trust, and it helps reduce cart abandonment. Analyzing trends within your shop’s available payment methods can help your team make better decisions regarding payment terms, shipping, and more.
It can also help you set and meet customer expectations at the pivotal point when they’re about to check out. During your live sales, you can remind customers that they can use “buy now, pay later” options like Sezzle. This can increase sales and impulse purchases during the thrill of the live-shopping experience.
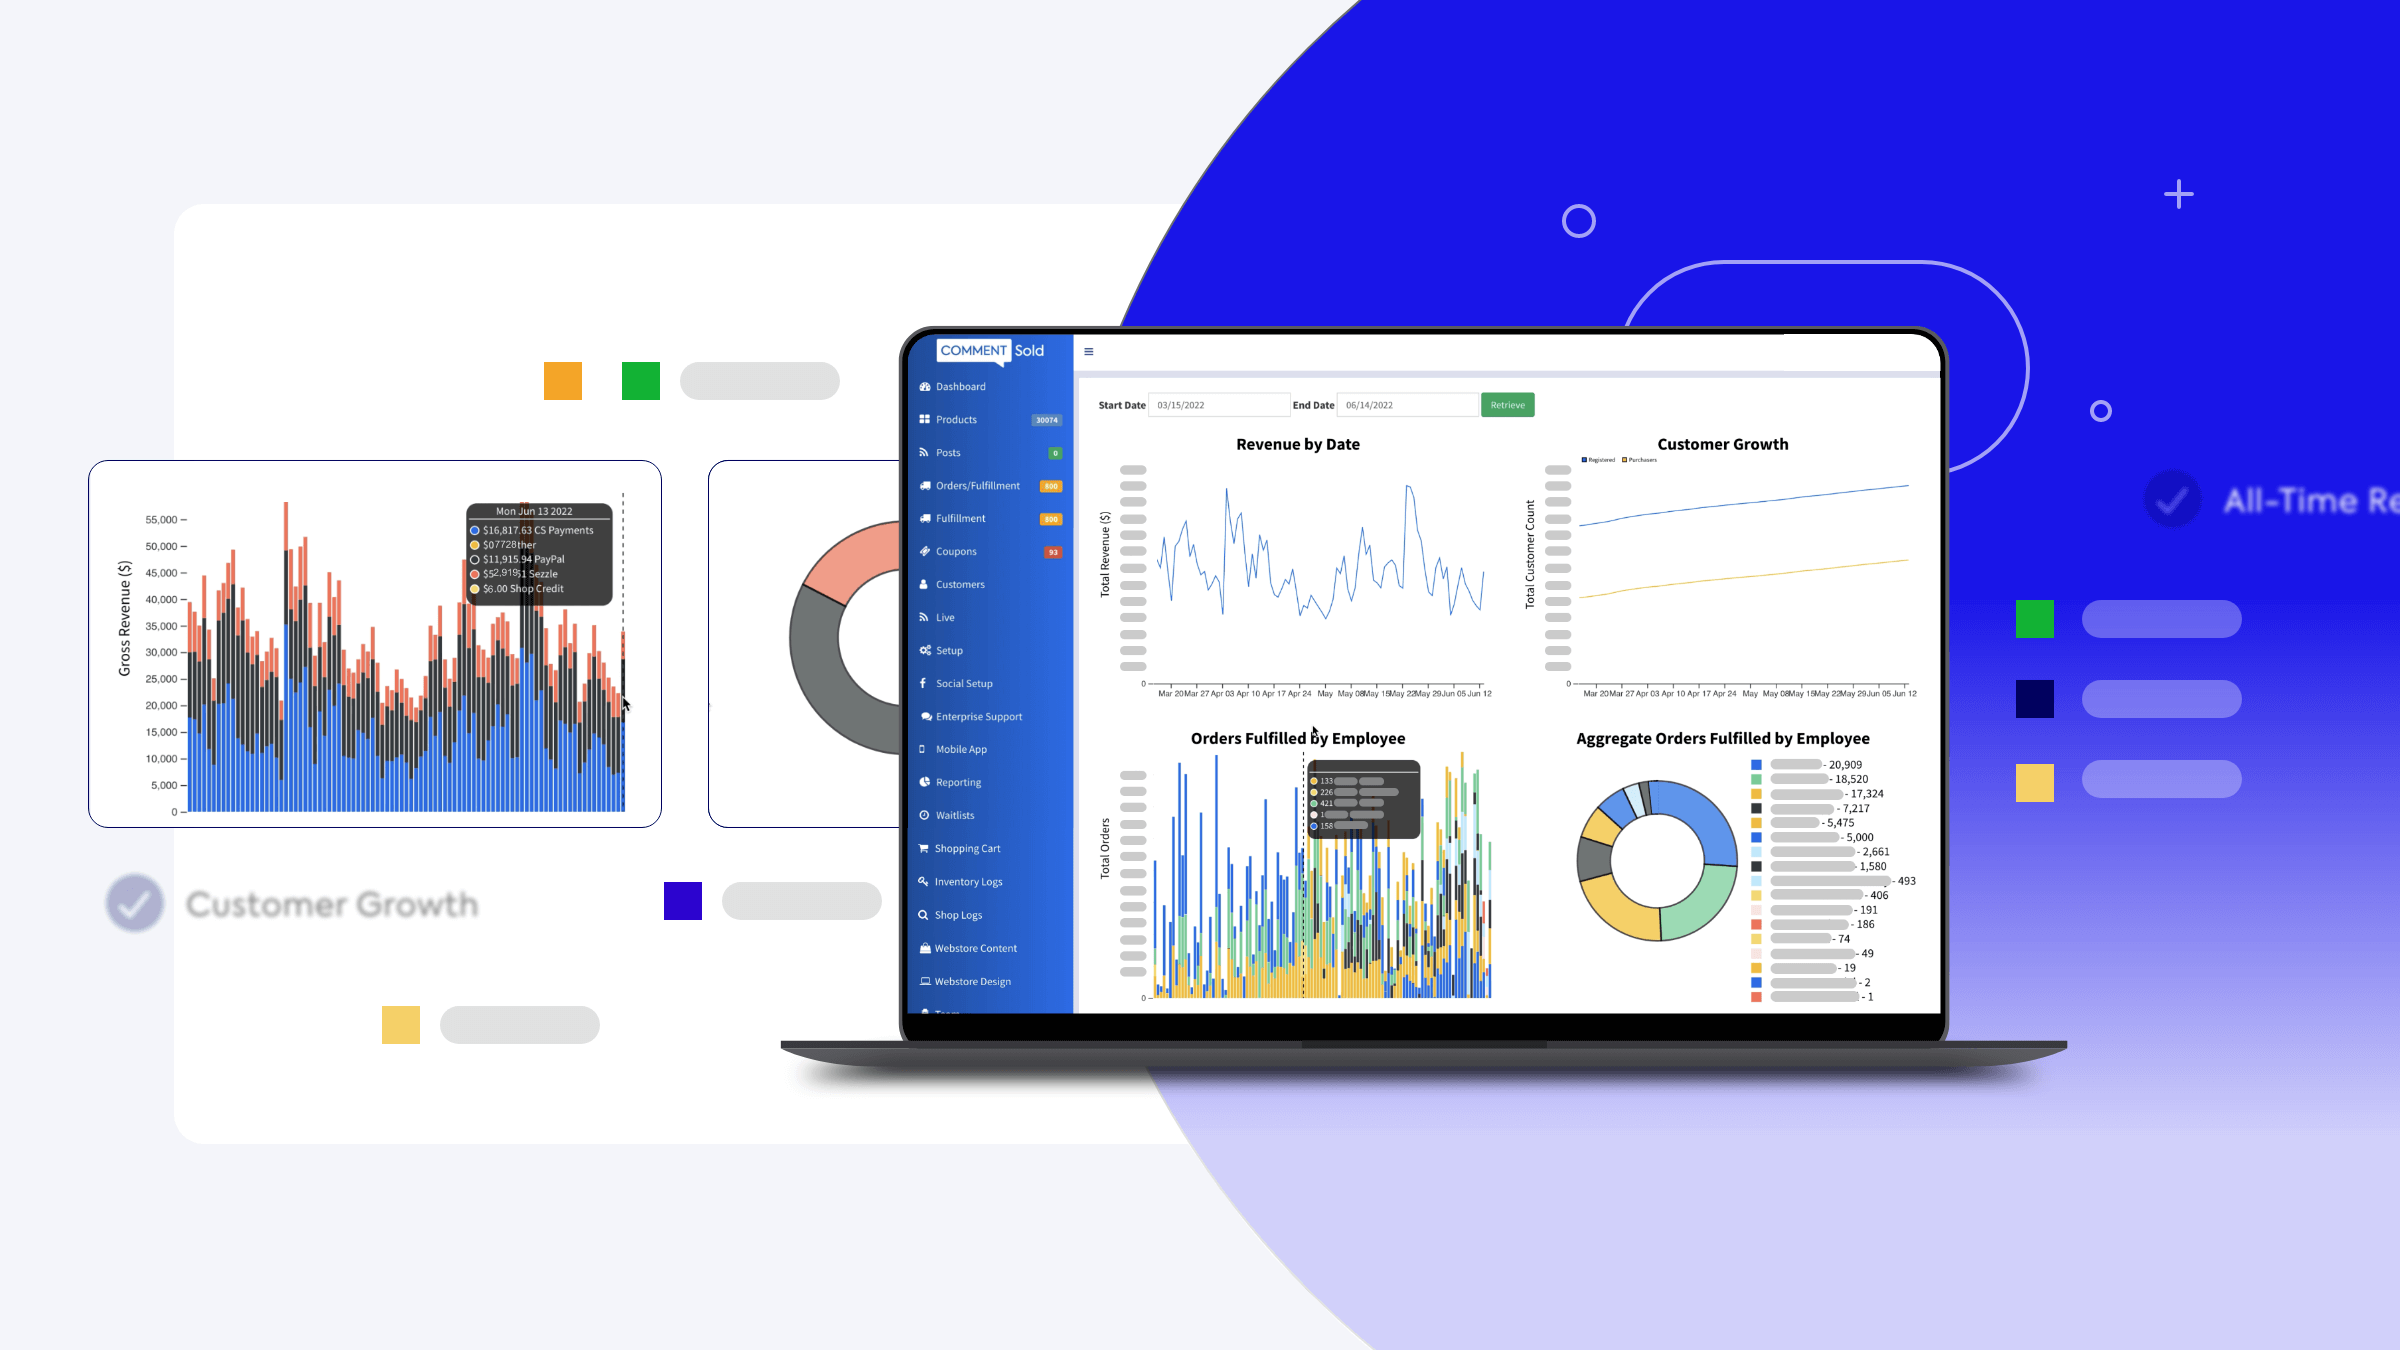
Four Data Points to Know in Your CommentSold Dashboard
Analyzing all of your business’s data is important, but it can be overwhelming. Breaking down your reporting into specific time frames to align with your monthly, quarterly, and yearly goals can help make the numbers more digestible. If you’re reviewing your analytics on a regular basis, consider focusing on these four key data points to help paint the entire picture of your retail business.
- Customer Growth
This data will display how many customers are shopping with your brand in a given period of time. You will also see how many of these customers have actually purchased from your store vs. those who have only registered with you. You may find that you have more sign-ups than actual buyers. Knowing this will help you adjust your marketing campaigns to target users who actually add products to their cart or check out, or you can adjust messaging to better promote checkouts during your live sales. - Average Order Value
Your average order value (AOV) is calculated by dividing the total revenue by the number of orders you receive. This metric is important because it gives you an inside look into your shoppers’ purchasing habits and patterns. AOV data can help you make decisions around pricing, marketing, and even how you style or bundle products. A higher AOV generally means your business will have higher revenue and profit numbers.
Keep in mind that your AOV is determined by the sales per order, not per customer. A shopper may check out multiple times during your live sale (which is encouraged!) and each order will be separately factored into your AOV calculation. This can artificially decrease your AOV so keep this in mind. - Average Viewership and Revenue Per Minute
You can view data on all of your live sales over time to see how your viewership changes. Ideally, you’ll be able to see growth in your live sale audience as your business expands and evolves. Revenue per minute will give you insight into how many viewers are actually purchasing items during your live sales. Breaking this data down to the minute can help you fine-tune your presentation during your live video sales and repeat strategies that help drive engagement and checkouts. - Orders Fulfilled by Employee
An important piece of any e-commerce business is order fulfillment. Ideally, you will grow a base of repeat shoppers who consistently purchase many of your items. If fulfilling their orders takes a significant amount of time, customer loyalty and repeat purchase rates are likely to drop. As your business grows, so too will your staff. Checking the data on order fulfillment can help you ensure things are running smoothly behind the scenes.
With these analytics, you can see which employees fulfill the most packages per day, broken down on a day-by-day basis. You can also view reporting on aggregate performance for the entire time period shown and see who’s doing the most. These reports can help you adjust training to maximize efficiency, see where there are performance issues, and reward employees who are consistently fulfilling the most
The Takeaway
Having a keen awareness and understanding of your data points is critical to making smarter business decisions that help grow your brand and boost total revenue. Viewing how different metrics relate to each other can give you a deeper look into how your business is performing, where you can make adjustments, and how you can keep up the great work in areas where you excel.
CS Analytics offers simple insights to know your business better. If you’re using CommentSold for your e-commerce business, you can view your analytics via the Dashboard. Visit the Help Center for more information on accessing CS Analytics.